Once the sensor has been correctly attached to the calibrator, the first calibration can be started.
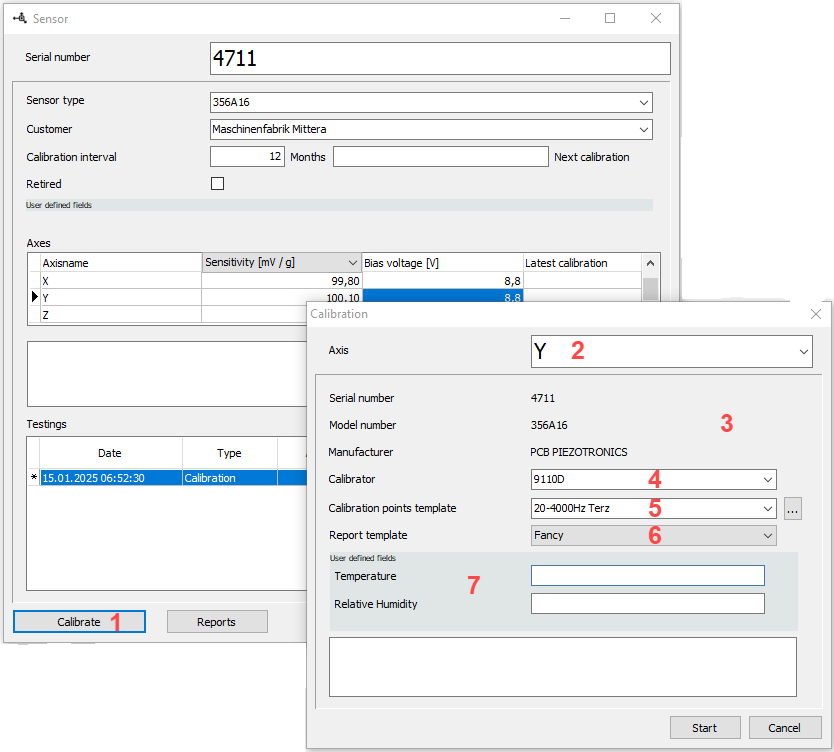
Select the axis to be calibrated from the Axis list and click the Calibrate button [1]. Another dialog opens showing the axis [2], general sensor data [3], which calibrator [4] and which calibration point template [5] will be used. It is best to use the existing “Fancy” report template [6]. This is followed by two user-defined fields [7] that require an entry. Press Start and the calibration will begin.
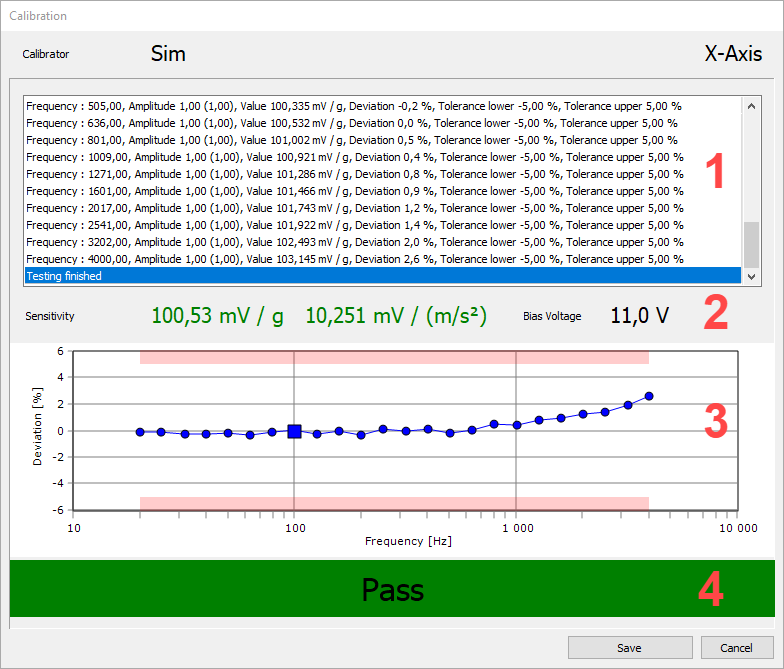
In the upper area [1] you can see which action the calibrator is currently performing, below this the determined sensitivity [2] and then the deviations from the determined sensitivity over the various frequencies [3]. A successful calibration is shown in the lower area [4] with a green bar, an unsuccessful calibration with a red bar. Pressing the Save button saves the calibration in the database and generates the certificate.
Congratulations, you have calibrated your first sensor.